The Average Price of Homes in Capital Cities, Based on Local Listings
Times are strange on the property market — and on a global scale. Covid-19 radically shook up our idea of where and how we wanted to live, and it also radically altered many peoples’ options for doing so. On balance, prices rose; but now, in the fallout of the pandemic and with the added complication of the energy crisis and war in Ukraine, they’re on their way down.
Higher interest rates and the cost of living have forced down demand for houses, although a general shortage of houses on the market has kept prices from bombing. Meanwhile, wages are falling in real terms (with a particular impact on lower-income workers), further inhibiting potential buyers from spending.
According to Oxford Economics, nearly all 38 OECD countries are likely to see a slowdown in house price growth, with prices actually falling in more than half of them. This would be the widest deceleration in housing price growth for over 22 years. And according to the IMF, real house prices could drop by 25% in emerging markets over the next three years and by 10% in advanced markets (although this is a worst-case view).
So, where do things stand around the world right now? NetCredit, an online lender offering personal loans and lines of credit, has calculated the average home price in total and per m2 in capital cities around the world and compared them to local incomes to see where we are.
What We Did
NetCredit analyzed over 800,000 online property listings for 73 global capitals and calculated the median house price for each city in total and per square meter (m2). We researched the average monthly net salary for each capital using numbeo.com and used this figure to calculate affordability and the number of years the average earner would need to work to buy a median-value home.
Key Findings
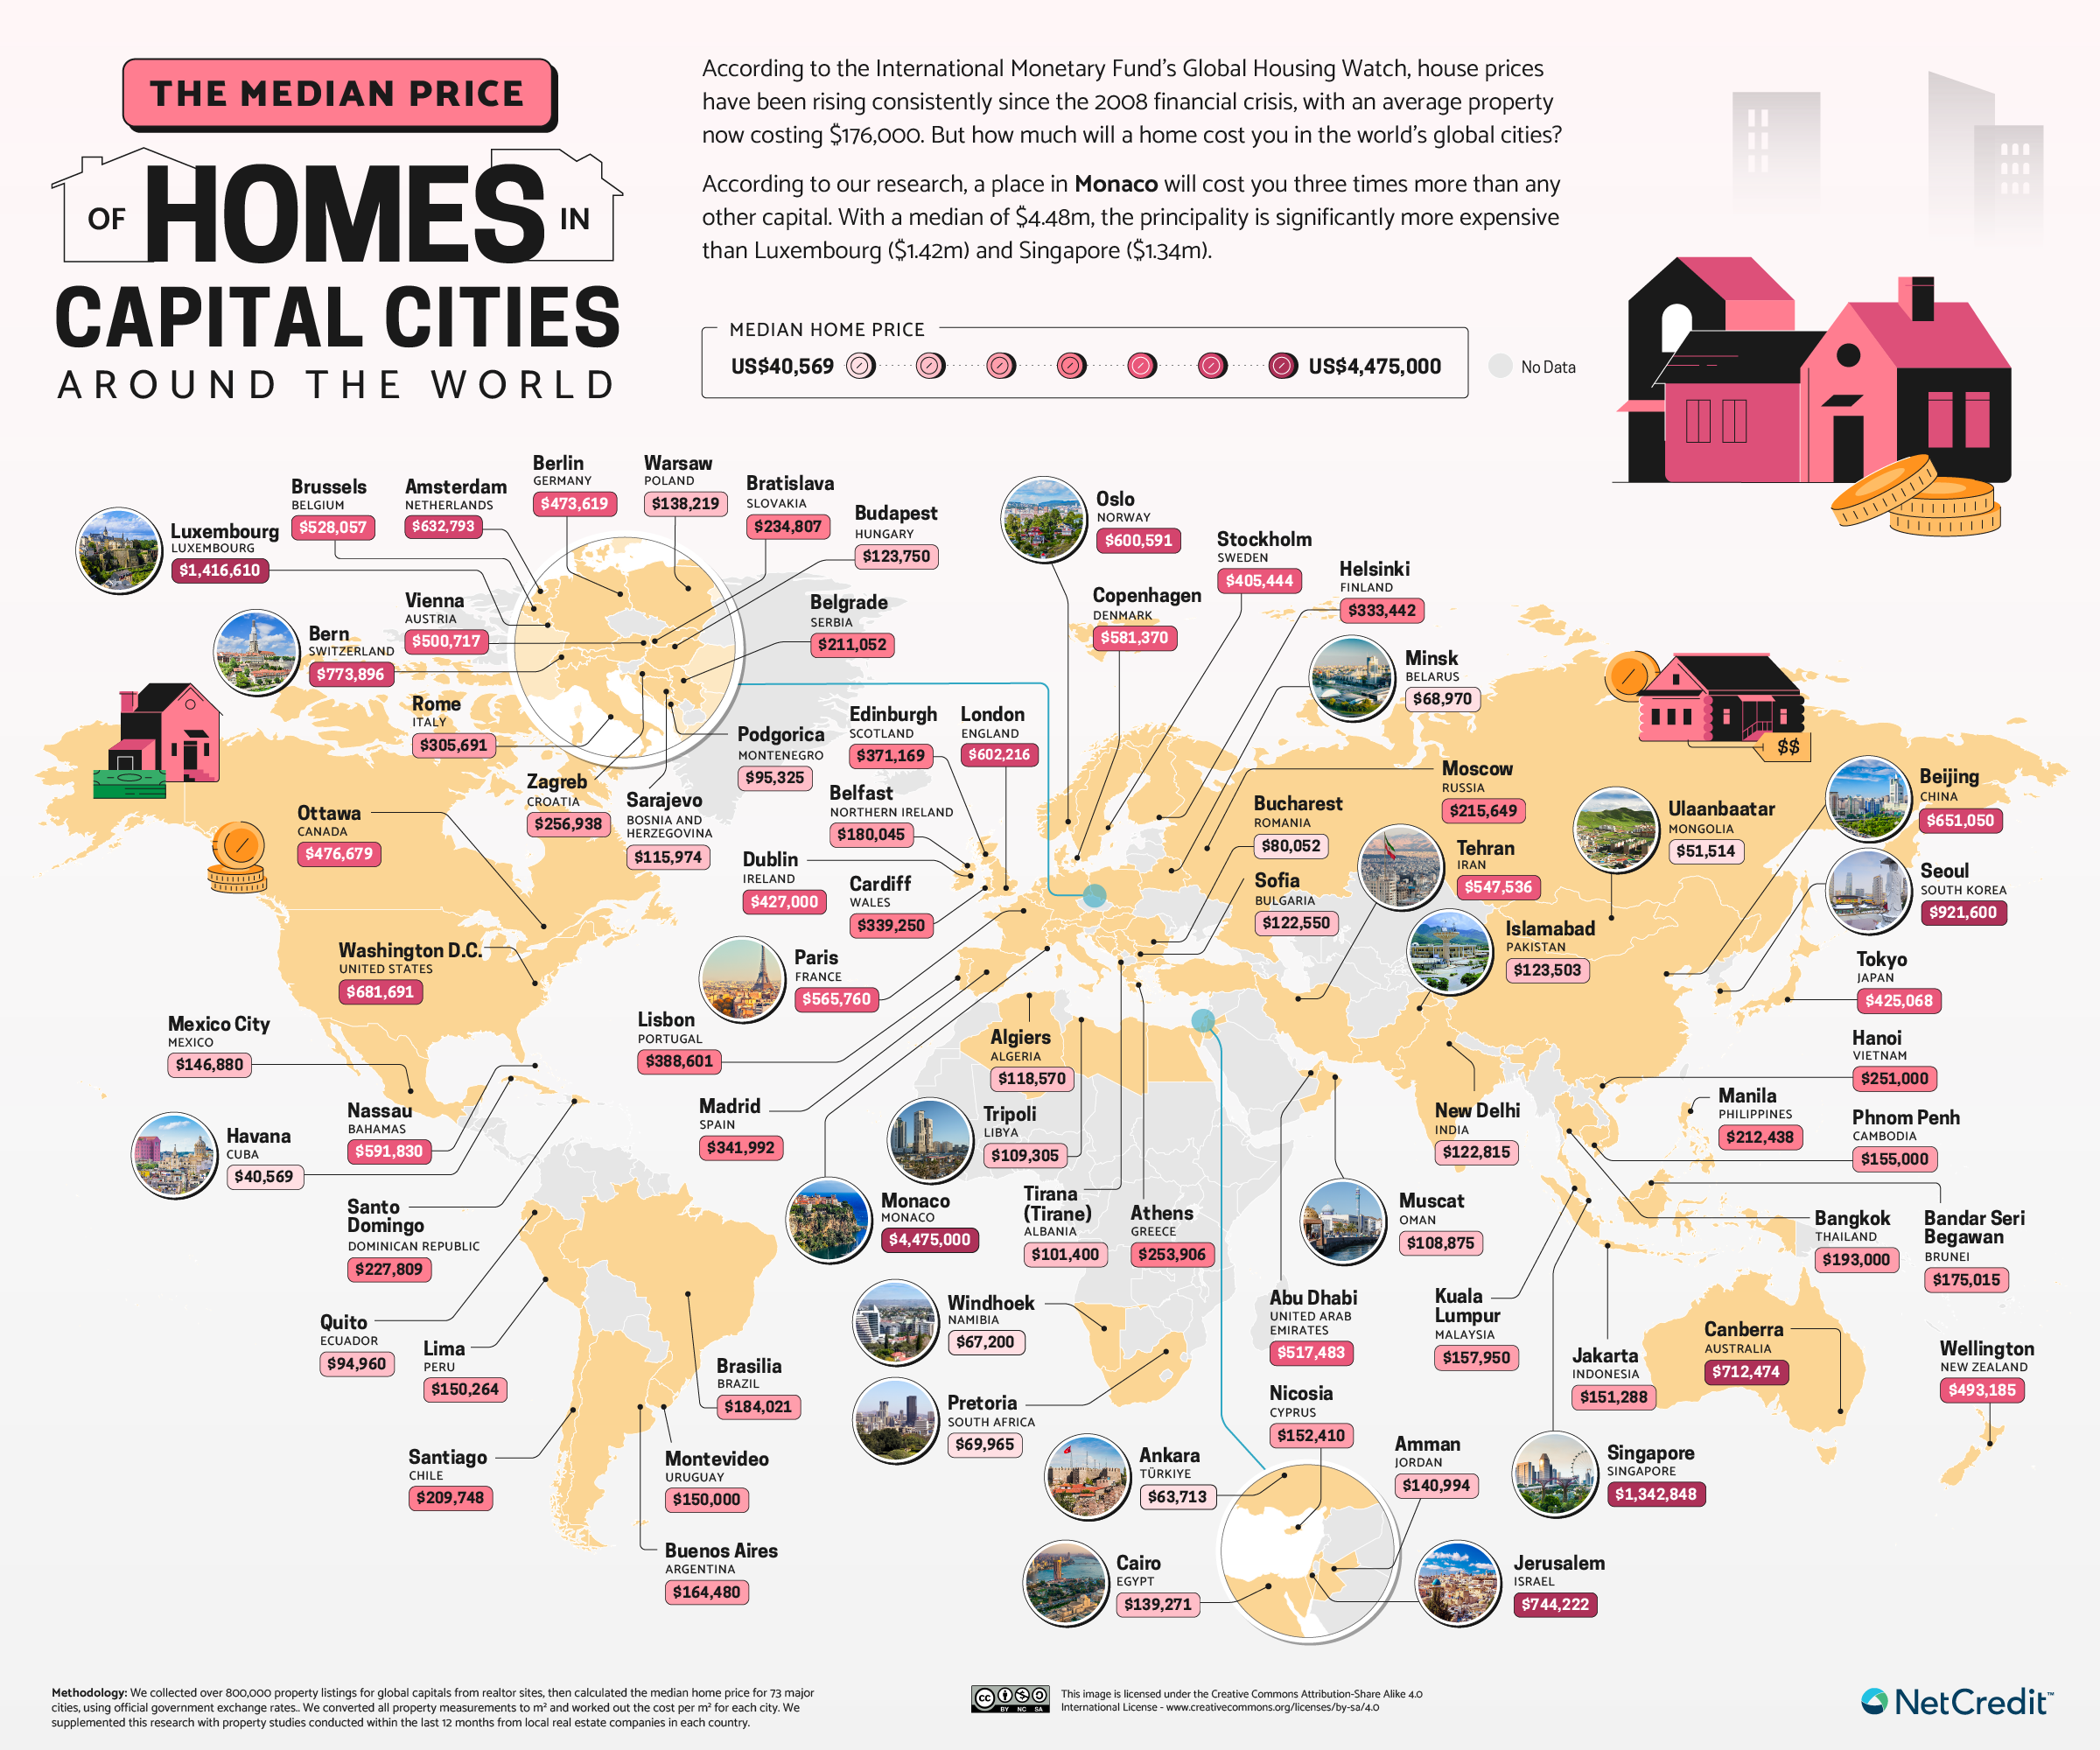
- The city-state of Monaco has the most expensive homes in the world, averaging $4,475,000.
- The capital with the cheapest average home is Havana in Cuba ($40,569).
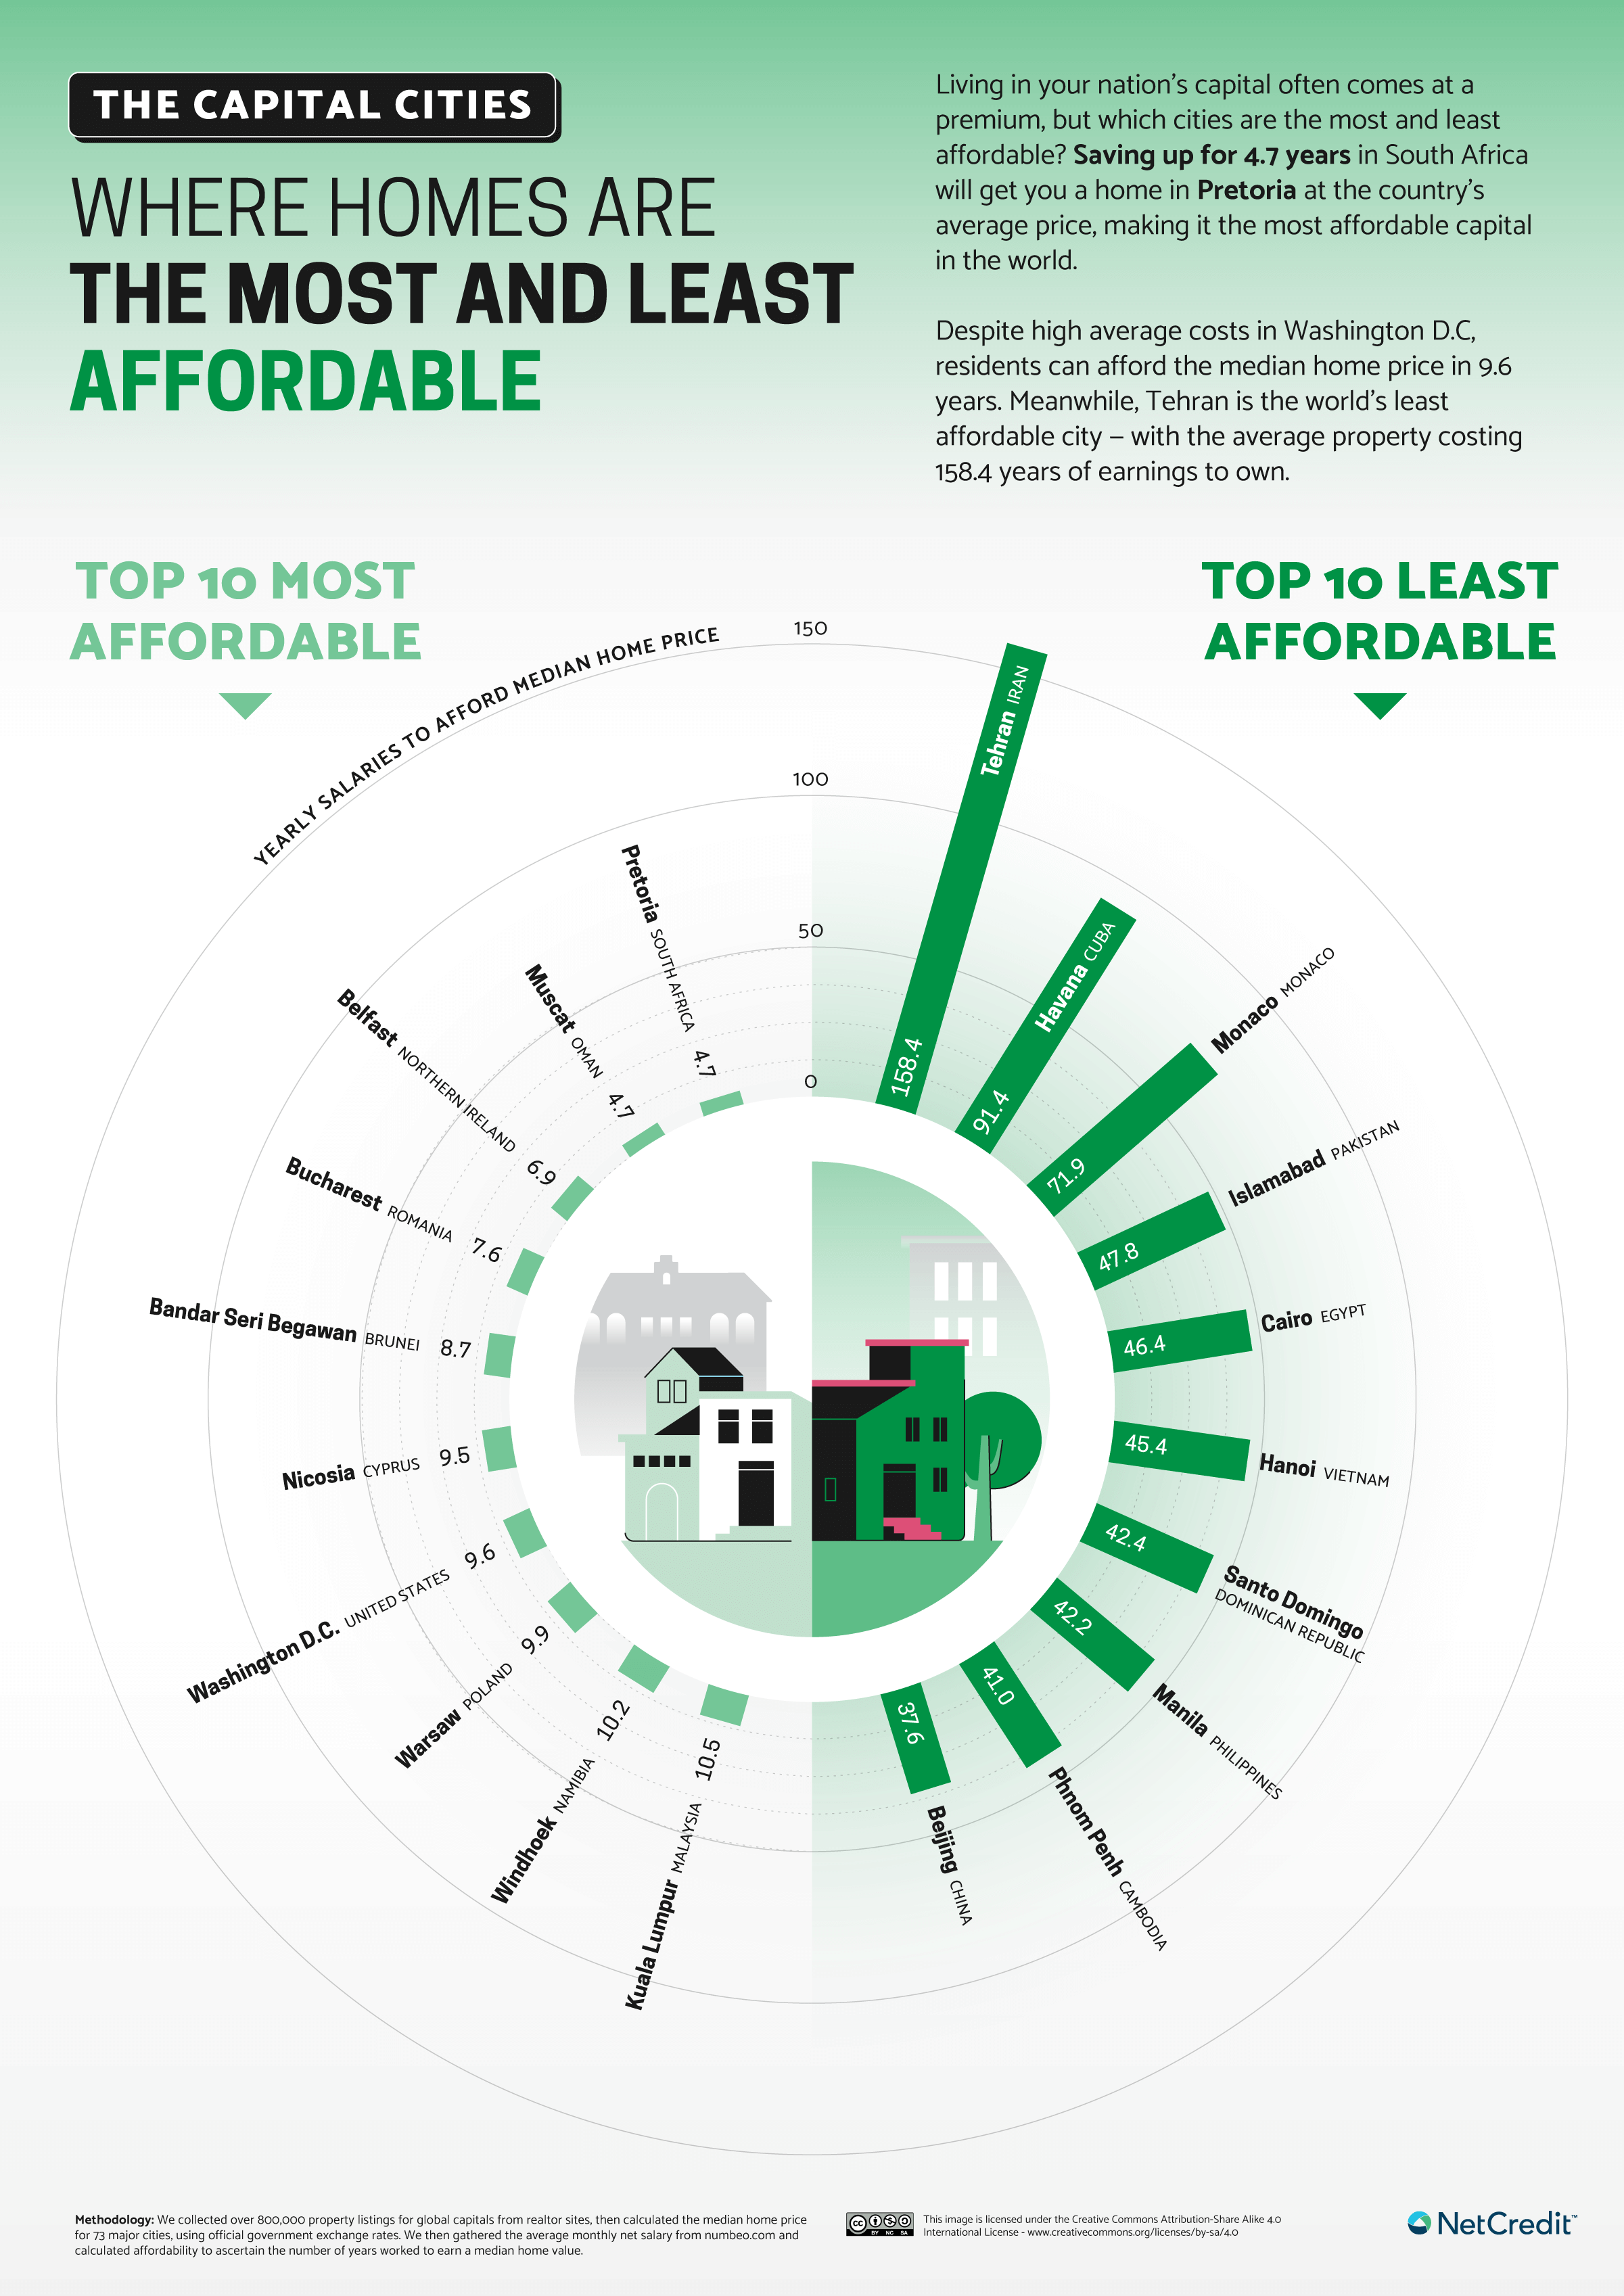
- Tehran, Iran, is the capital with the worst affordability of homes, with the average property costing 158.4 times the average yearly salary.
- The South African capital, Pretoria, has the best affordability, with the average home costing just 4.7 times the average salary.
U.S. and China Jostle for Spot Among Top 10 Most Expensive Property Markets
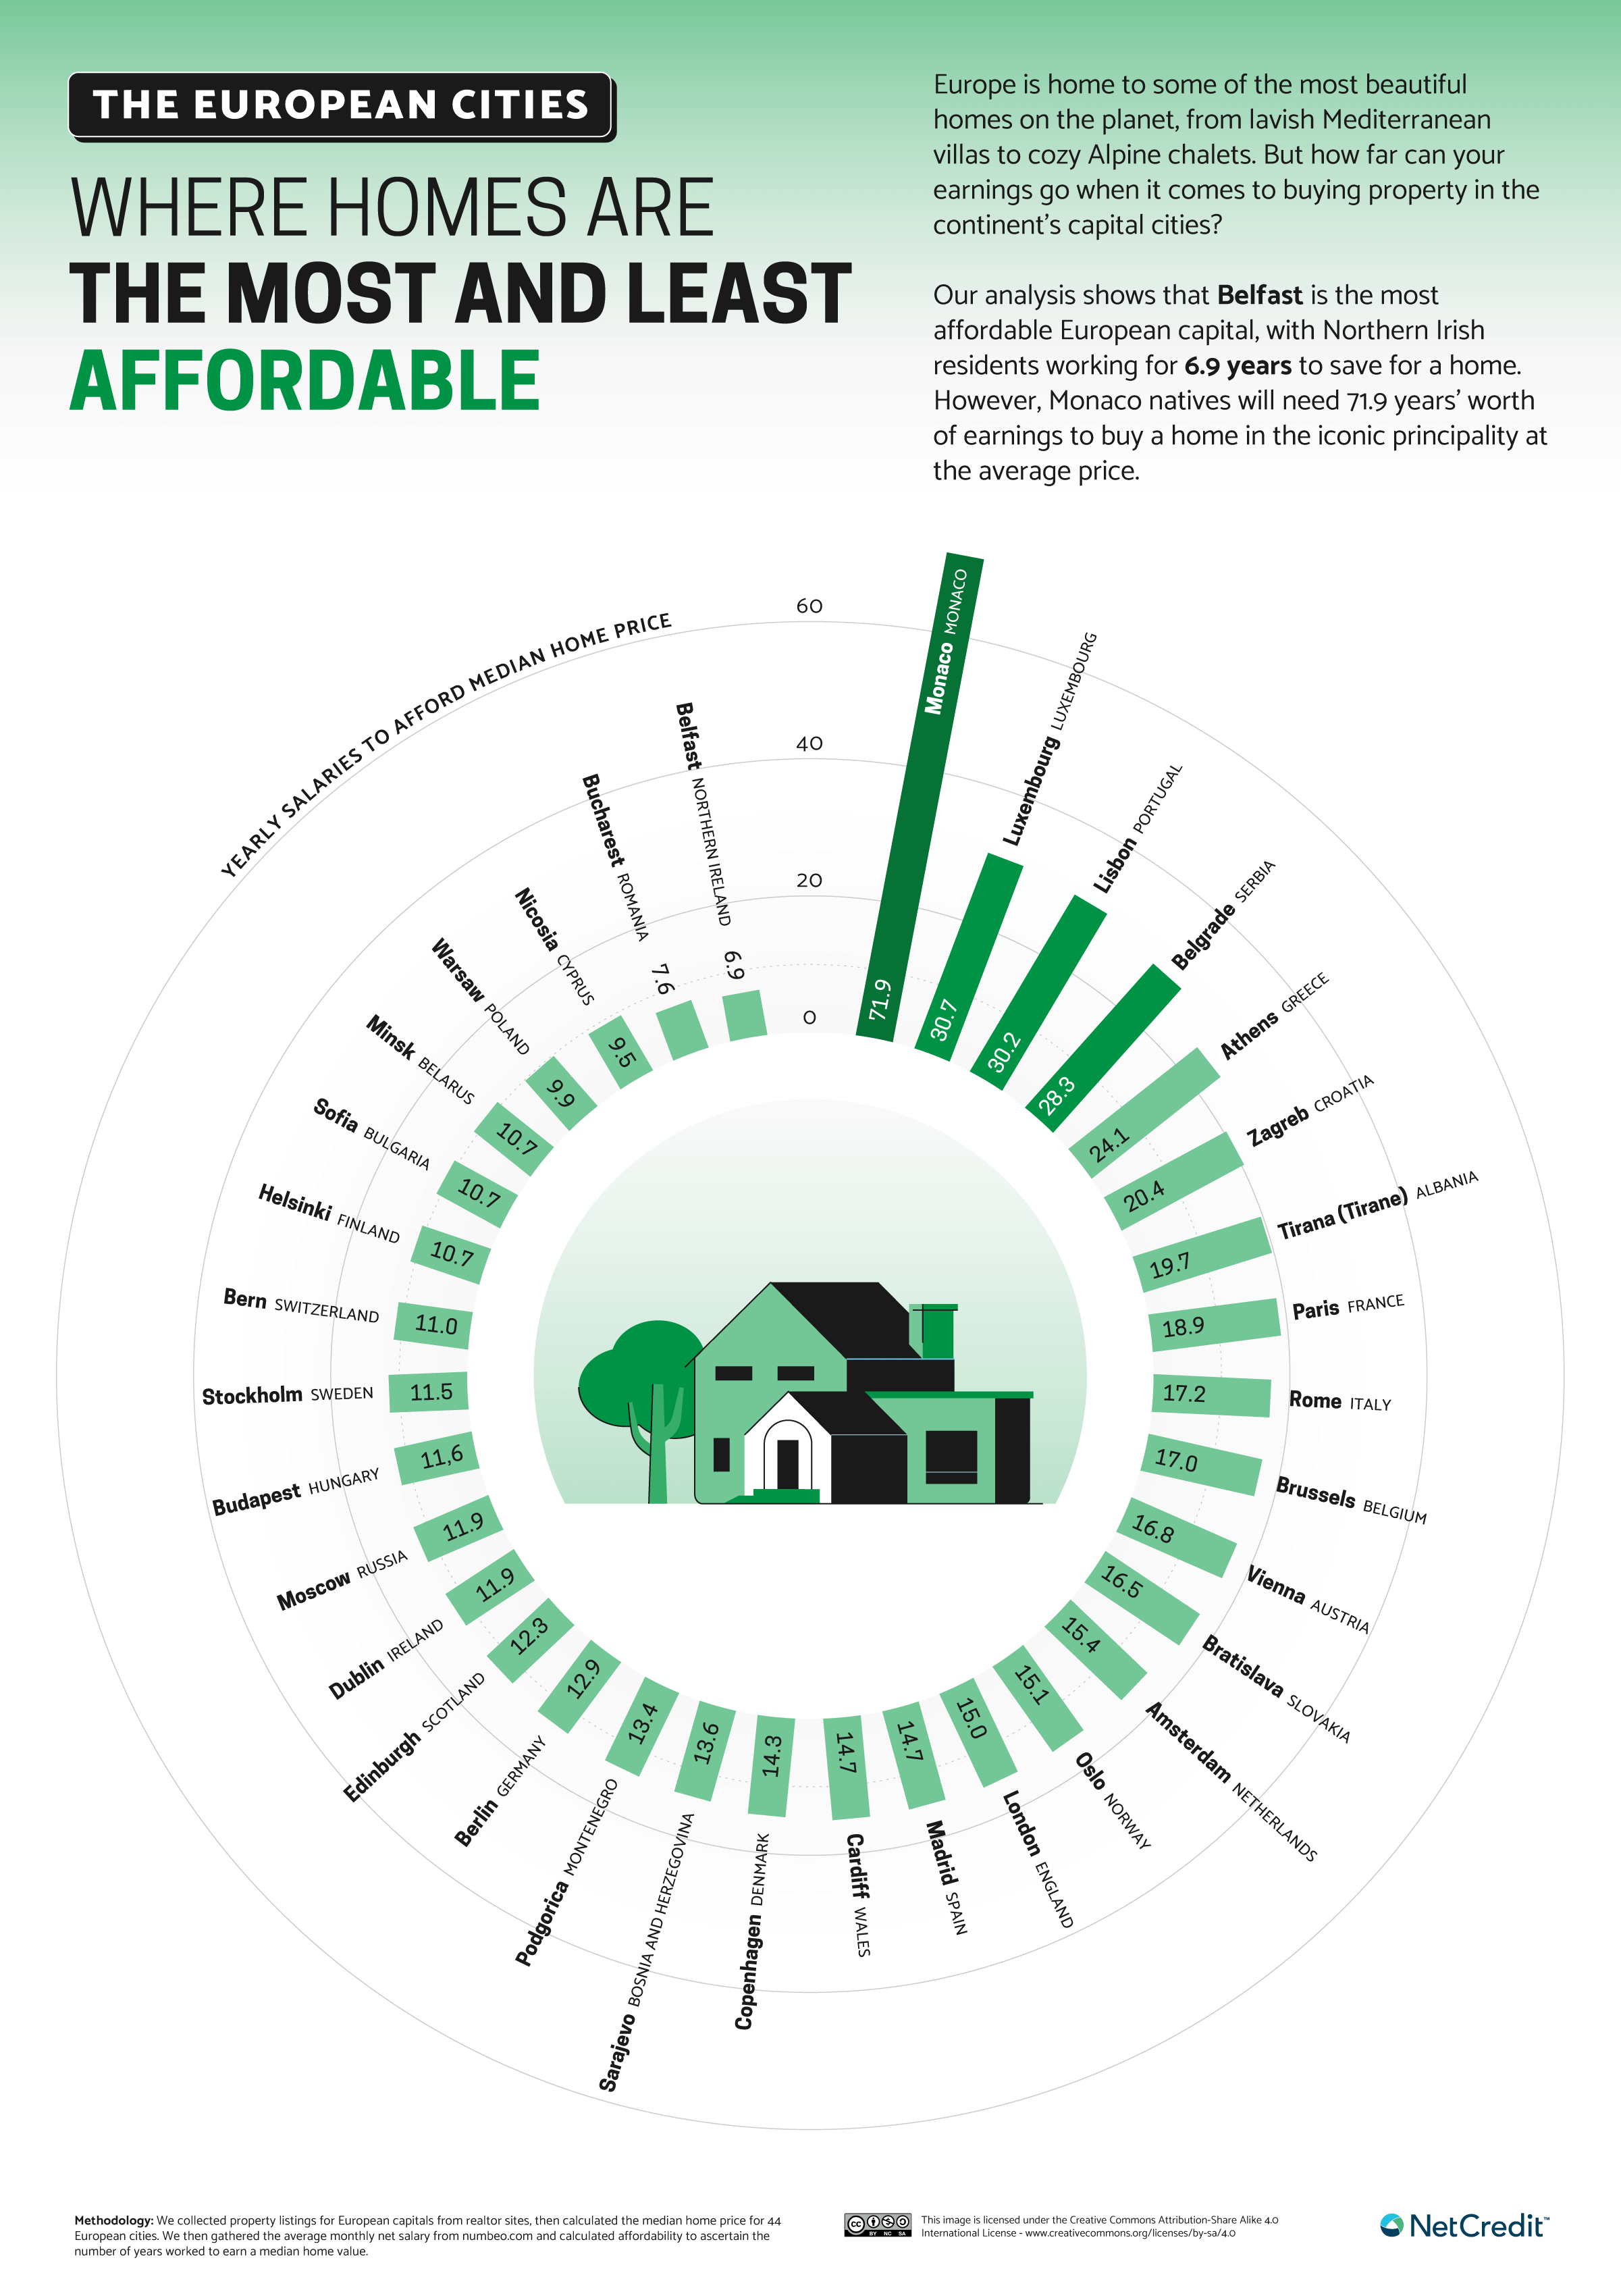
Monaco has the most expensive homes in the world. As a luxury mecca and tax haven on the Mediterranean coast, Monaco attracts wealthy buyers who compete for a very limited amount of property. While one-third of Monaco’s population are millionaires, only 25% of the country’s private-sector employees live within the country’s borders, with property not just expensive but unaffordable for many; Monaco has the third-worst affordability in our study, with the average home costing 71.9 times the average annual salary.
Click here to see the image in full size
The most expensive capitals are a mix of small city-states and the capitals of small, medium and larger countries. The top five are divided between Europe and Asia, while just $30,000 separates the capitals of the U.S. and China in ninth and tenth position. While the competition for limited real estate drives up prices in smaller regions, areas such as the Australian capital, Canberra, can attribute high prices at least in part to the enormity of the houses.
Paris and Tehran Among Capitals with Worst Deals for Homebuyers
Relative house prices like those above can tell us a lot. But we need to delve a little deeper to get a ground-eye view of what those prices mean in real terms. High prices seem less unreasonable if an area tends to have larger homes (you’re getting what you pay for). On the other hand, if prices are high where wages are low, it’s a tough break for low earners — regardless of the amount of bang they’d get for their hard-earned buck.
Click here to see the image in full size
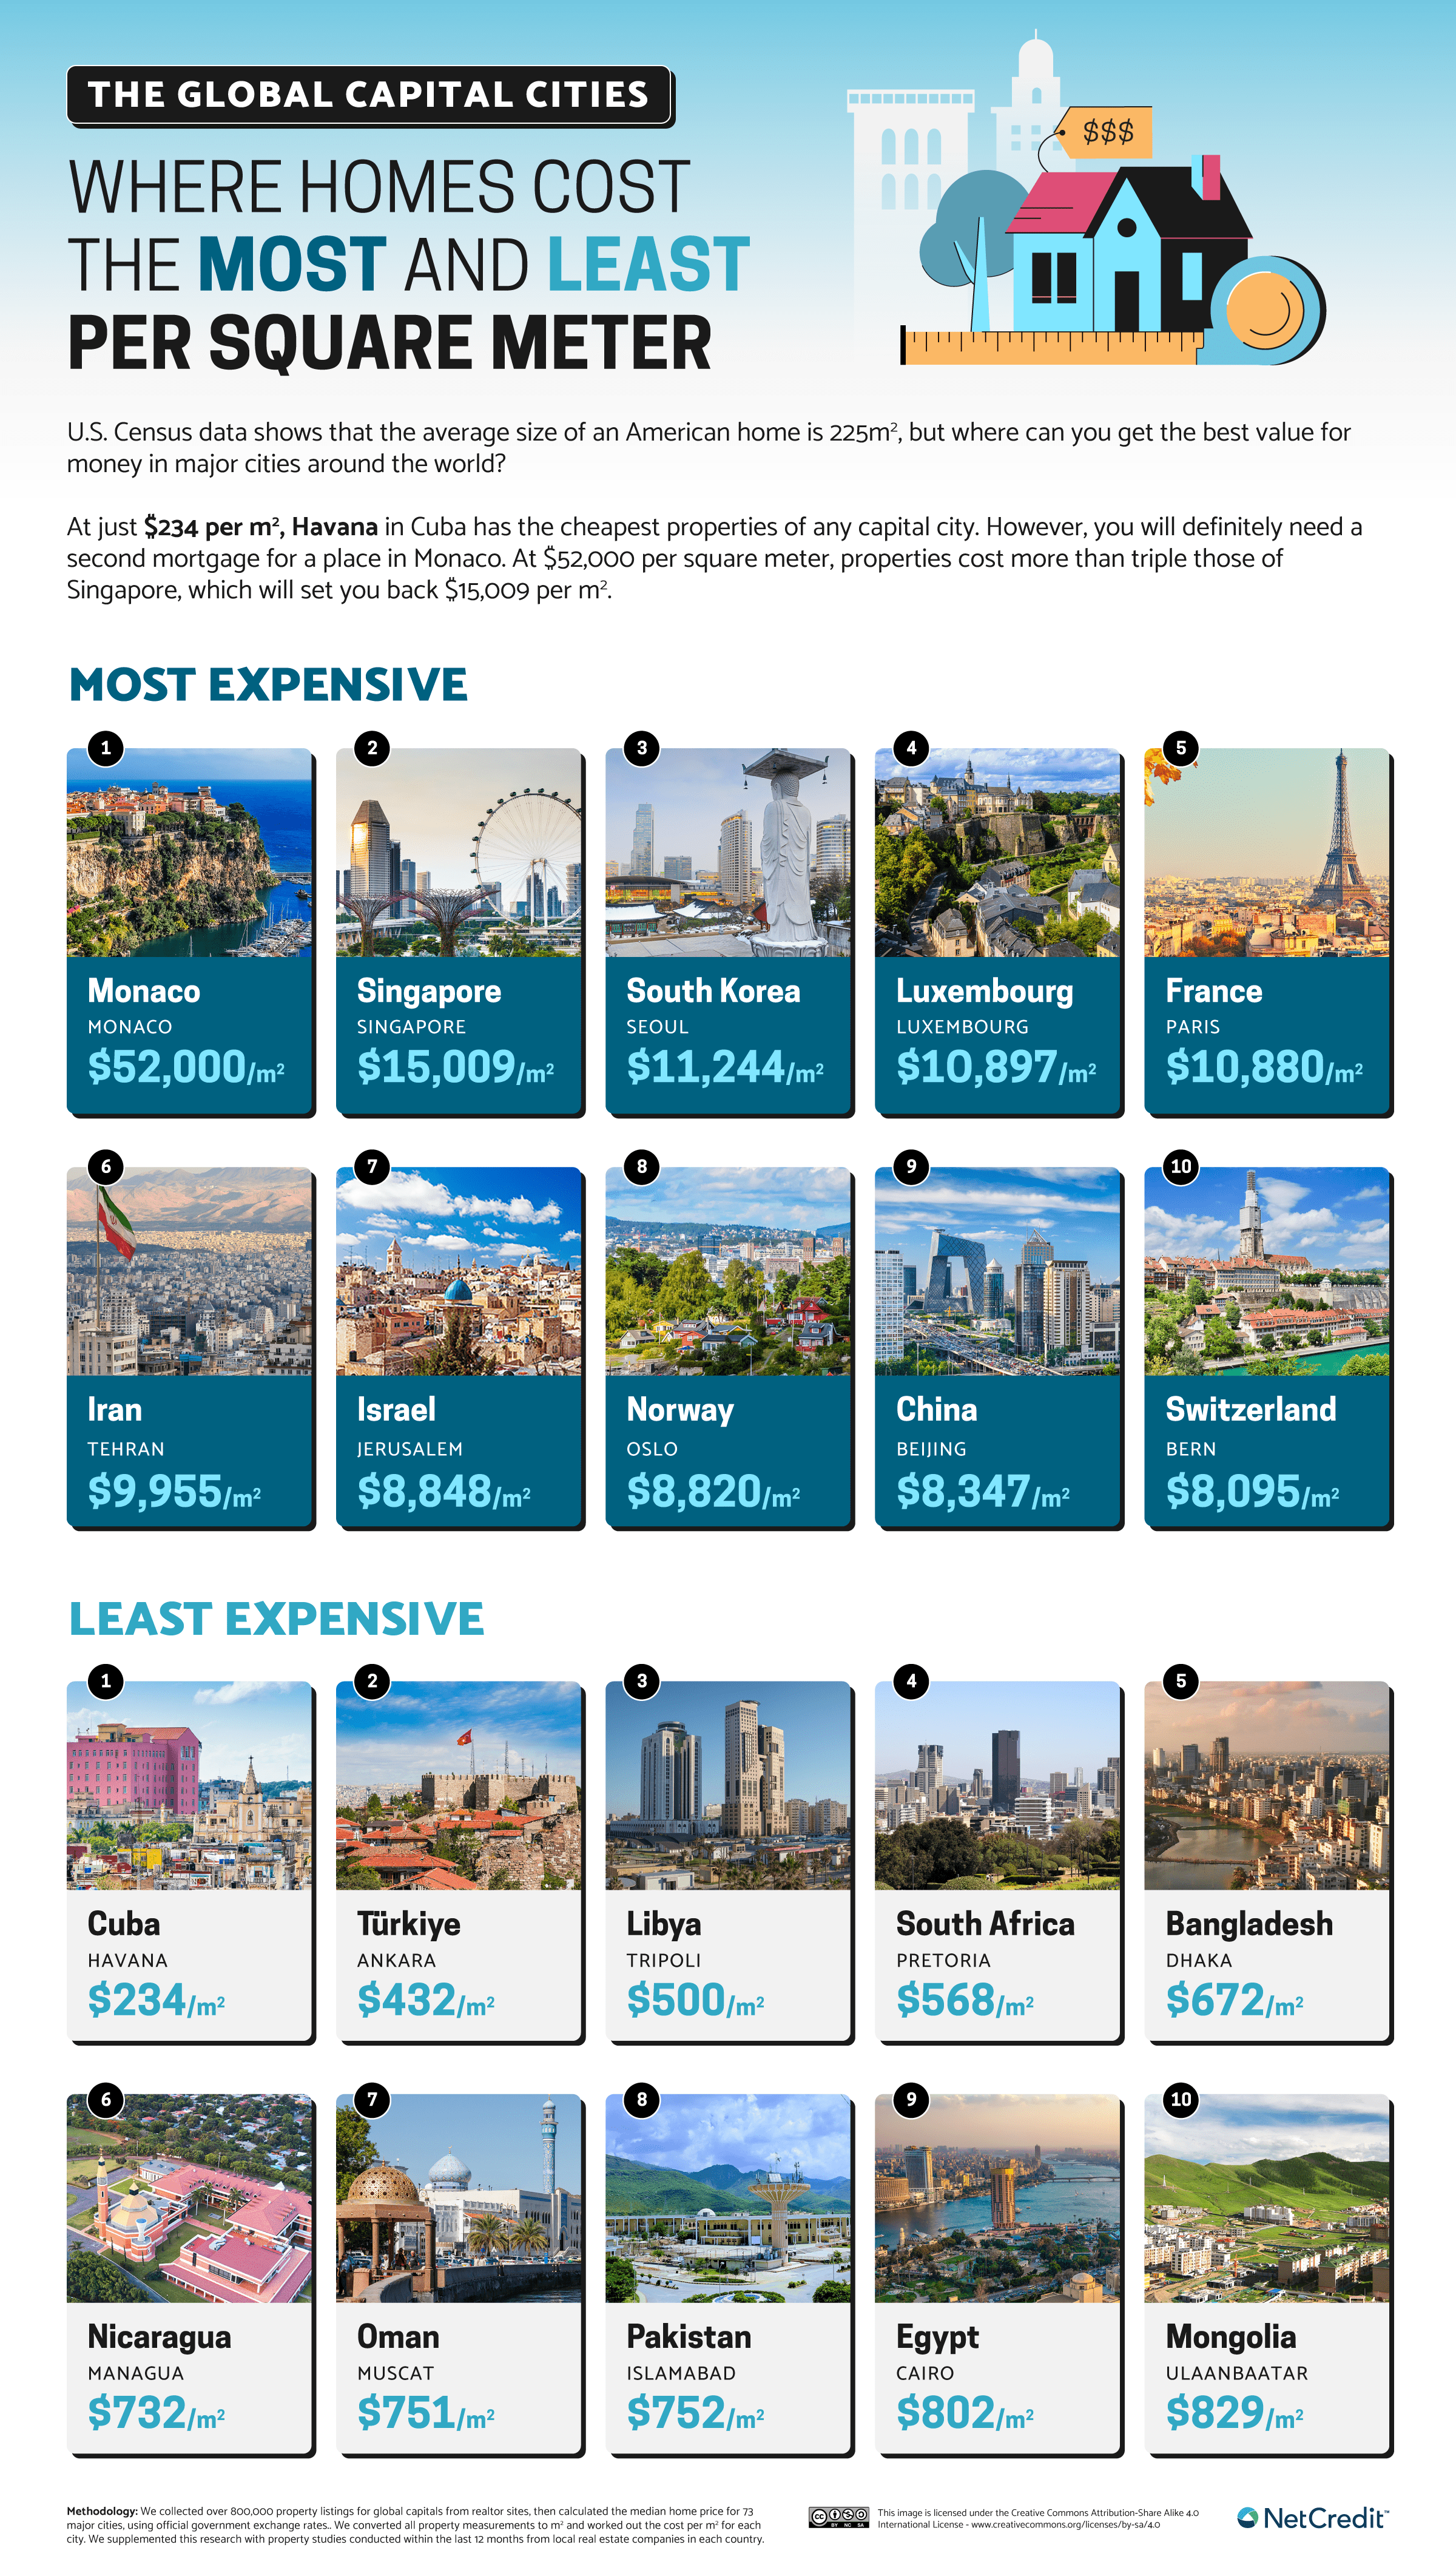
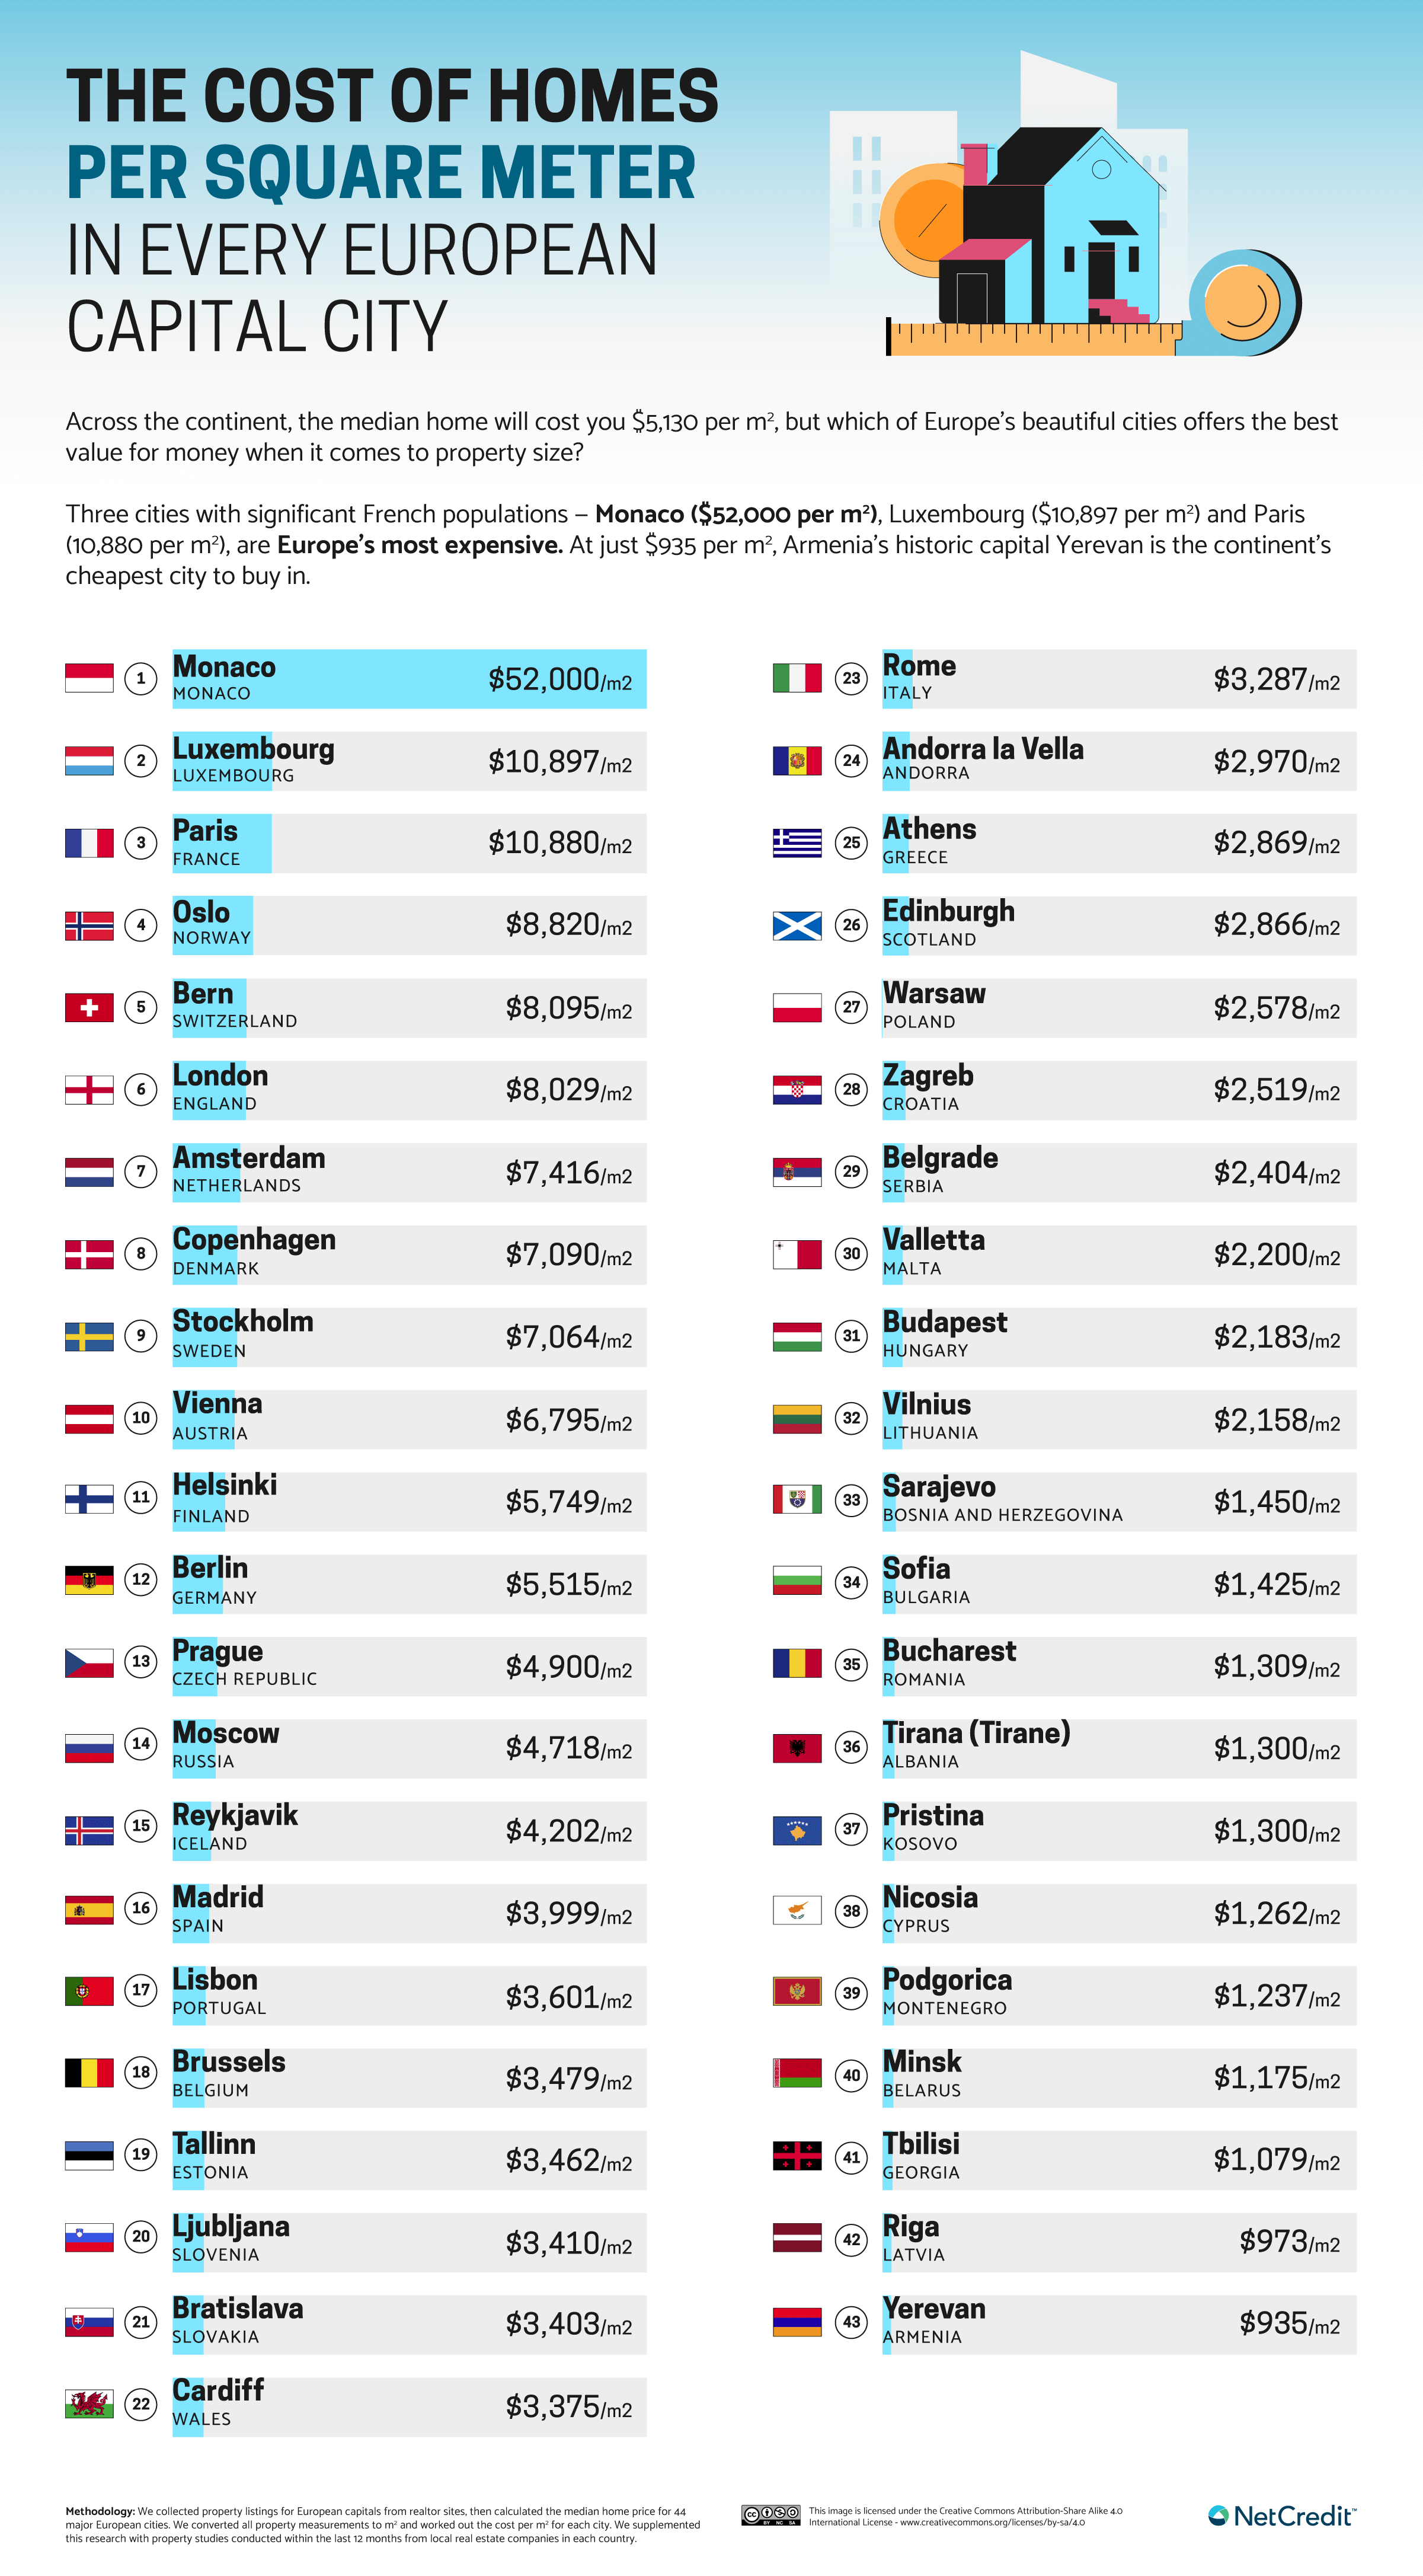
Looking at price per square meter, it’s no surprise that Monaco remains on top, as the average Monaco home is so much more expensive than everywhere else to start with. However, judged per m2 rather than list price, Singapore and Seoul leapfrog Luxembourg into second and third place. Paris, Tehran and Oslo are also among the 10 most expensive per m2, despite not making the top 10 for average prices overall. Small apartments and high demand (especially as EU professionals flee London post-Brexit) have pushed the price of a square meter in the French capital over the $10,000 mark.
Click here to see the image in full size
Judged by price tag alone, Tehran is only the 17th most expensive world capital. But that average $547,536 home is a steep ask in a country with a minimum wage equivalent to $203 USD/month. And property costs a whopping $9,955 per m2 due to the relative smallness of most Tehran homes. The urban area of Tehran has a higher population than London or Paris, and apartment living is the norm. While a house in Tehran may offer a spacious alternative to an apartment, inflated prices push up the average in a city that has suffered a nine-fold price increase over five years.
A Good Deal on Property in Eastern Europe
Europe’s most expensive capital city homes per square meter are clustered to the west and north of the continent, while the lower end of the table skews towards eastern Europe and the Balkans. However, a notable exception occurs in the UK: while London — the capital of both England and the UK — has an average price of over $8k/m2, the capitals of Scotland (Edinburgh) and Wales (Cardiff) have averages of $3,375 and $2,866 respectively. (Figures per m2 were not available for the Northern Ireland capital, Belfast.)
Click here to see the image in full size
The Czech Republic’s capital, Prague, is the most expensive Eastern European entry. Prague witnessed a 20.13% rise in house prices between 2020 and 2021 due to high demand. However, prices appear to be stagnating now, in a reflection of patterns seen in other regional markets: the cost of living and price of remortgaging is causing owners to sell up in droves, flooding the market with properties and dragging down prices.
Click here to see the image in full size
Compared by affordability, there is more of a geographic mix across European capitals. Expensive cities such as Monaco, Luxembourg and Paris are joined among the least affordable by cheaper, low-income Balkan markets such as Belgrade (Serbia), Athens (Greece) and Tirana (Albania). Meanwhile, parts of Eastern Europe offer the best all-round deal: Warsaw (Poland), Minsk (Belarus) and Bucharest (Romania) all offer a price per m2 of around $2,500 or less, at a rate that can be paid off with the equivalent of 11 local annual salaries or fewer.
Planet Property
It’s easy to get caught up with local trends and price patterns. But an appraisal of the global property market can put your local situation into stark perspective when considering buying or selling a home. You can use our comparison tool, below, to compare the cost and affordability of any two capital cities in our study and the interactive table to explore our data in full.
Homeowners will be wary of the tough times ahead and the concern that falling house prices will eradicate the equity on recently bought homes – particularly if they witnessed the downfall of the banks 15 years ago. However, lessons have been learned and the situation seems less volatile this time around. Either way, in a moment of turmoil, homeowners and prospective buyers alike will feel the urge to look around and see if they could get a better deal elsewhere — whether through lower prices, a better deal per m2, or a fairer affordability rate compared to local salaries.
METHODOLOGY & SOURCES
This dataset was compiled using two methods: our own country-by-country analysis of property listings, and manual research to find property studies conducted within the last 12 months from local real estate companies in each country.
We collected the property listings for 73 global capital cities from various sources [1] and converted the prices and the floor areas to USD and square meters accordingly.
We then calculated the median home prices and prices per square meter for each city in the dataset. We also gathered the average monthly net salary from numbeo.com and then calculated affordability to ascertain the number of years worked to earn a median home value.
To supplement this data, we manually researched property studies conducted in each country in 2022 to cross-reference against our own data and to add additional capital cities where their property websites lacked specific data points.
The data was collected in October 2022.
[1] Example Sources*:
– Spain: Idealista.com
– Singapore: 99.co
– Scotland: Rightmove.co.uk
– United States: Zillow.com
– China: est.fang.com
*Sources are indicative of examples used and not an exhaustive list
DISCLAIMER: This content is for informational purposes only and should not be considered financial, investment, tax or legal advice.